Anipose Tutorial
Welcome! This is a tutorial that will help familiarize you with the workflow of Anipose.
Setting Up the Project
We have prepared a dataset to help you learn how to use Anipose. In this demo, we will be using Anipose to track the positions of 21 different keypoints on the hand (see Figure 1). Begin by downloading hand-demo-dlc-TuthillLab-2019-08-05 and hand-demo-unfilled.
(You may also find it useful to reference hand-demo-filled, which has the expected output after completing this tutorial.)
The DeepLabCut project folder contains a pre-trained DLC network, and the hand demo folder is the Anipose project folder. Then do the following:
In the DLC project folder, change the
project_pathvariable in theconfig.yamlfile to the path where the the DLC project folder is located on your machineIn the folder containing the hand demo videos, change the
model_foldervariable inconfig.tomlto the path where the DLC project folder is located on your machine. This path should match the path in theproject_pathvariable from above.
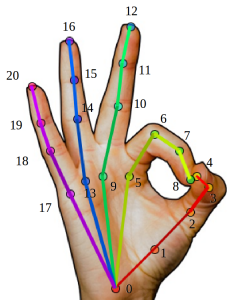
Figure 1. Schematic of a hand depicting the location of all 21 keypoints that we will be tracking in this demo.
Understanding Configuration Parameters
There are parameters in the Anipose config.toml file that are pertain to
project setup, camera calibration, filtering data, triangulation, and
angle calculation. When analyzing your own data, these parameters can be
changed according your objectives and preferences, so it is important
to understand what each parameter does. Some of the relevant parameters
are discussed in this tutorial, but if you would like a more general reference,
Anipose Configuration File Parameters contains a description of
all of the parameters in config.toml.
Analyzing the Data
Navigate to the hand-demo-unfilled folder and run the following command from the
command line:
anipose analyze
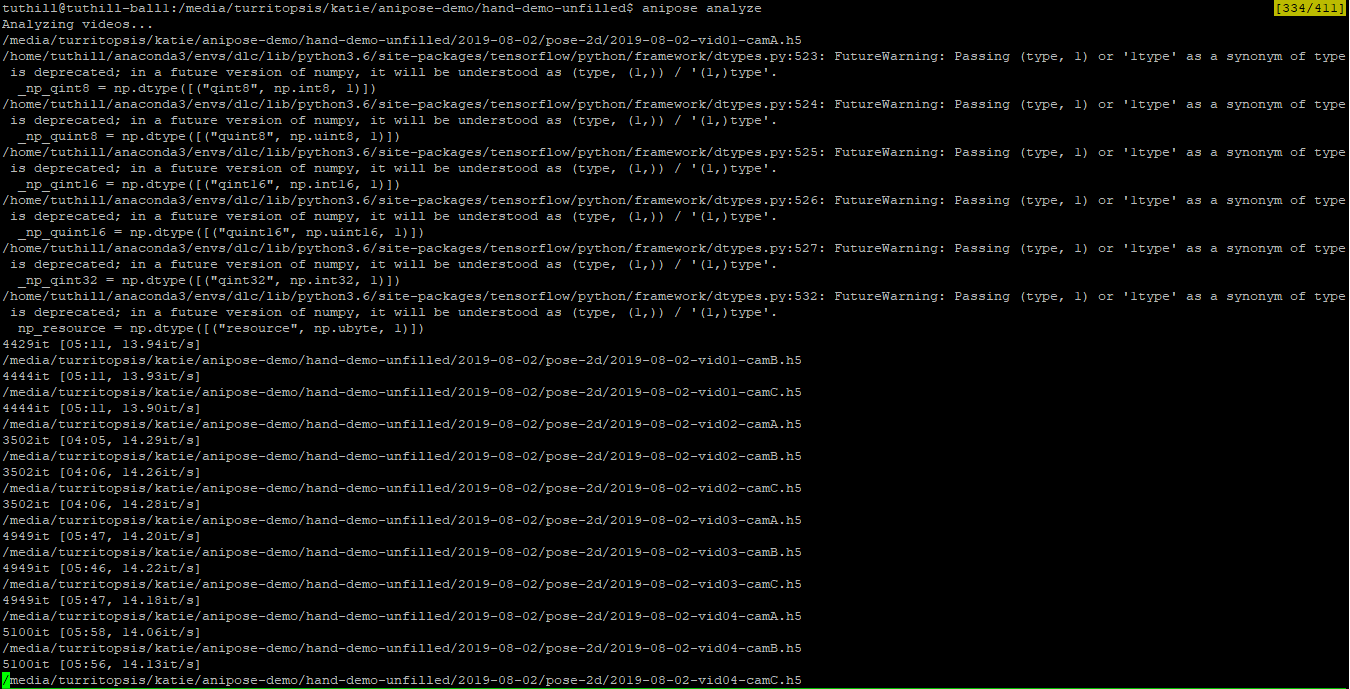
If you received an error instead of the output shown above, you may have forgotten
to change the path variables in config.yaml and config.toml. If this is
the case, please see Setting Up the Project to ensure that you are specifying
the project paths correctly.
Filtering the Data
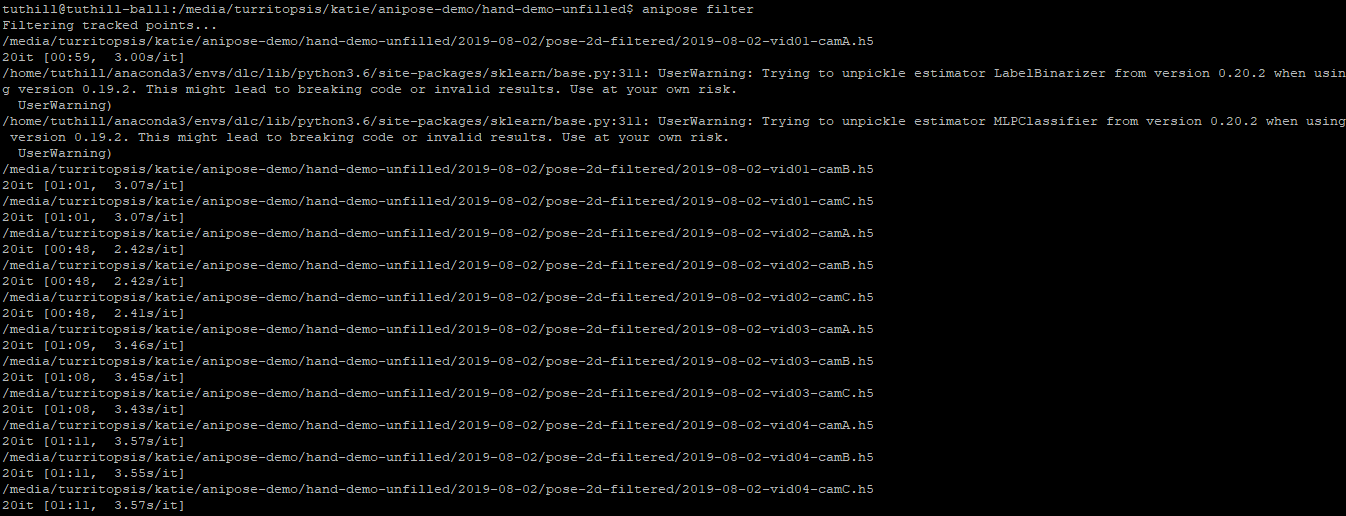
The following command will apply a Viterbi filter to the predicted keypoints:
anipose filter
The filter applied over the 2D data functions as a threshold filter.
Predicted labels that do not fall within the threshold are removed
and replaced with a new prediction that is determined by interpolating.
In config.toml, the parameter spline can be set to true for
interpolation using a cubic spline, or false for linear interpolation.
In hand-demo-unfilled/2019-08-02, you will see that a new folder named
pose-2d-filtered has been created. This folder contains h5 files that
encode the the most likely x- and y-coordinates of each keypoint after
filtering the 2D data.
Generating 2D Labels
Next, to plot the filtered predicted 2D labels on each frame, run
anipose label-2d-filter
This will create a folder in hand-demo-unfilled/2019-08-02 called videos-labeled-filtered
that contains a labeled version for each of the videos that were initially in the
Anipose project folder. The lines that connect the 2D labels can be specified with
the scheme parameter in the Anipose config.toml file.
Feel free to navigate to this folder and watch a couple of the videos. For example,
you should find that the labeled video generated for 2019-08-02-vid01-camA.avi
looks like this:
There is also the option to view the unfiltered predicted 2D labels on each frame by running
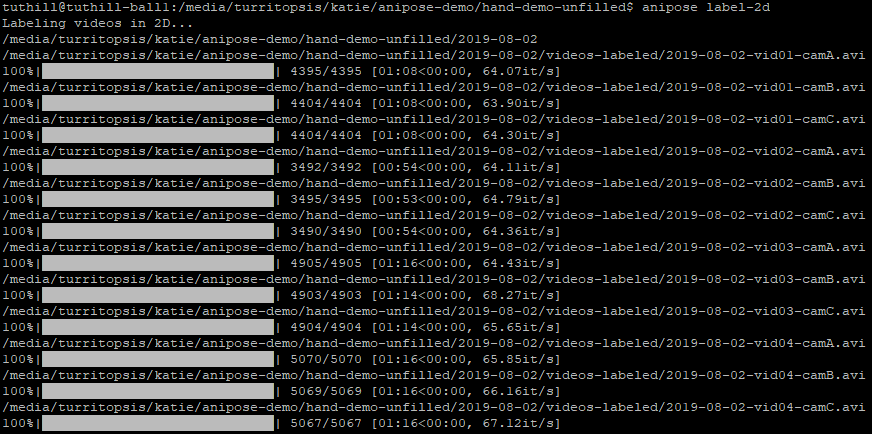
anipose label-2d
which will generate videos with unfiltered predictions in hand-demo-unfilled/2019-08-02/videos-labeled.
Calibrating the Cameras
Before labeling the videos in 3D, the cameras have to be calibrated. The command
anipose calibrate
Performs camera calibration of intrinsics and extrinsics. These parameters are
determined by minimizing the reprojection error through iterative bundle adjustment.
The reprojection error is a metric to quantify how closely the 3D projections
of a triangulated 3D point match the 2D detections in each camera. The
hand-demo-unfilled/2019-08-02/calibration folder will be updated to include
the camera parameters obtained from 3D calibration in calibration.toml.
The calibration videos were initially in this folder.
Note that the cameras can be calibrated with ArUco, ChArUco, or checkerboards. The
relevant parameters in config.toml for this step relate to the board used for
calibration. For this demo, the videos were calibrated with a ChArUco board, as shown
in Figure 2. In config.toml, board_size specifies the dimensions of the board used
for calibration, square_side_length specifies the length of the squares in the
board, and board_marker_length specifies the size of the marker within each square.
These dimensions can be specified in any units, as long as they are consistent for all
of the calibration board parameters. In the config.toml file, we set
fisheye = true because our videos were taken with cameras that have fisheye lenses.
When running Anipose on your own data, these parameters will need to be set according
to your calibration.
Figure 2. Schematic of the ChArUco board used for camera calibration.
Triangulating Data
Now, let’s triangulate the data with the following command:
anipose triangulate
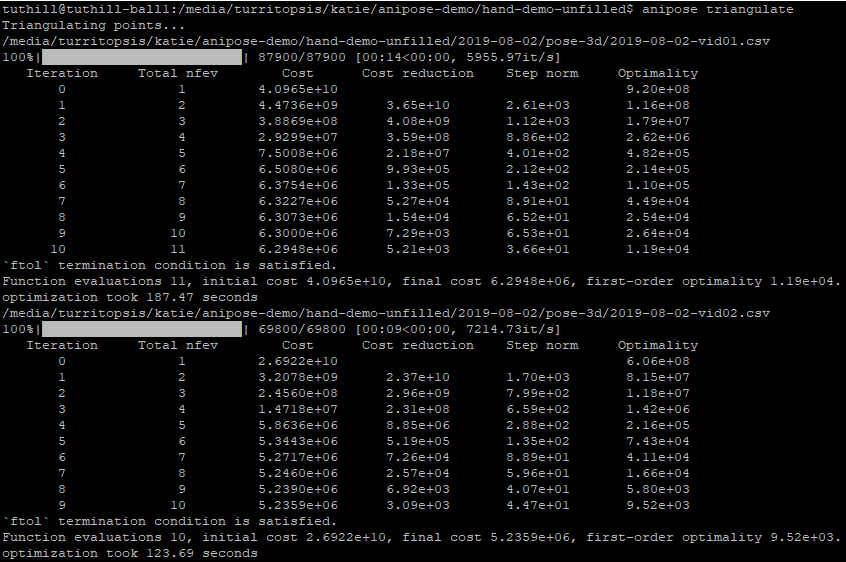
When running Anipose triangulate, you will see output for each group of videos that looks like the output shown above. It contains information about the optimization of the cost function.
For each group of videos (videos that were taken at the same time, but from different
cameras), there will be a csv file generated in hand-demo-unfilled/2019-08-02/pose-3d
containing information about the triangulation.
In config.toml, smoothing and spatial constraints can be specified for triangulation.
The constraints parameter contains all of the pairs of keypoints that you wish to impose
constraints between. The scale_smooth and scale_length parameters specify the
extent to which smoothing and spatial constraints are enforced, respectively. These
constraints help reduce tracking errors.
By default, the anipose label-3d command also applies filters to the 3D data, similar
to the anipose filter command used to apply 2D filters. The parameter optim in the
Anipose config.toml file specifies whether the 3D filters are applied. If you do
not want to apply 3D filters, you may replace optim = true with optim = false
in the config.toml file.
When optim = true, the 3D filters can be configured by specifying parameter values
in config.toml. The score_threshold parameter specifies the score below which
a label is considered erroneous. The filter functions in removing these points, as
they are likely errors in tracking, and interpolates instead.
Generating 3D Labels
Now that the data have been triangulated, we can plot the predicted labels from the 3D tracking for each group of videos. To do this, run the following command:
anipose label-3d
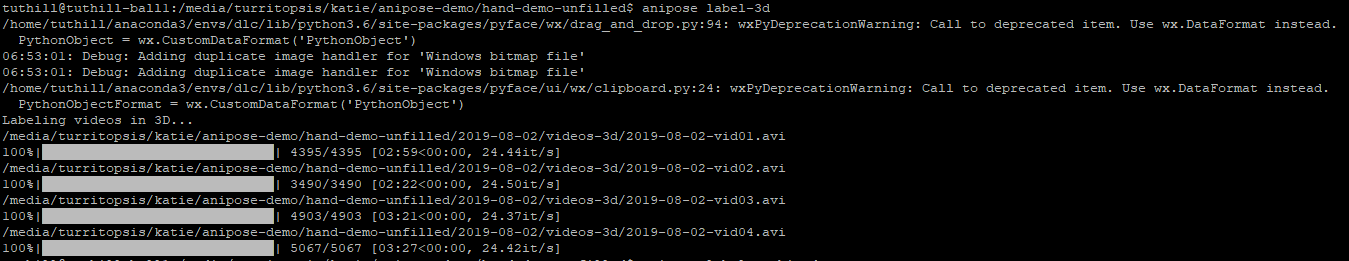
This step will generate 4 videos of the 3D tracking in hand-demo-unfilled/2019-08-02/videos-3d,
since one video is generated per camera group (the number of cameras in the setup).
The resulting video from hand-demo-unfilled/2019-08-02/videos-3d/2019-08-02-vid01.avi
is shown below.
Generating Combined Videos
To concatenate the videos for each group of videos obtained from running anipose label-2d
and anipose label-3d, run
anipose label-combined
The combined videos will be contained in hand-demo-unfilled/2019-08-02/videos-combined.
Four combined videos are created by following this tutorial. Here is the combined video from
hand-demo-unfilled/2019-08-02/videos-combined/2019-08-02-vid01.avi.
When using anipose label-combined, the videos concatenated in the top panel correspond
to those generated from anipose label-2d. Each panel contains the labeled video from
a different camera view, so the number of panels corresponds to the number of cameras
used. The 3D model generated from anipose label-3d is displayed on the bottom half
of the combined video.
Computing Angles
In the config.toml file, variables can be specified under [angles] to tell Anipose
to compute the angles between three given keypoints. These angles are computed in degrees,
ranging from -180 to 180. With these angles in the config.toml file,
[angles]
index_1 = ["MCP2", "PIP2", "DIP2"]
index_2 = ["PIP2", "DIP2", "tip2"]
middle_1 = ["MCP3", "PIP3", "DIP3"]
middle_2 = ["PIP3", "DIP3", "tip3"]
ring_1 = ["MCP4", "PIP4", "DIP4"]
ring_2 = ["PIP4", "DIP4", "tip4"]
we can run
anipose angles
as shown above to generate an angles folder in hand-demo-unfilled/2019-08-02. Within
hand-demo-unfilled/2019-08-02/angles, there will be a csv file containing the
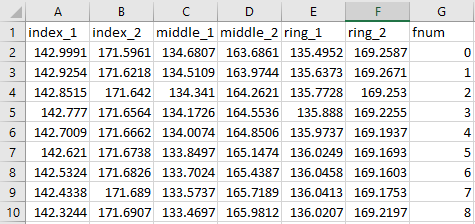
specified angles for each of the groups of videos. Each column in the csv file corresponds
to an angle, and the rightmost column contains the frame number.
The names of the angles that appear in the column header of the csv file correspond to
what you named the variable with the corresponding keypoints in config.toml. For instance,
the index_1 variable specifies the keypoints required to calculate one of the
angles between three of the keypoints that were tracked on the index finger, and the
ring_1 variable specifies the keypoints required to calculate one of the angles
between three keypoints that were tracked on the ring finger. The first few lines of
2019-08-02-vid01.csv are shown below.
Different Rotations
There is also the option to compute the angle for one of three types of rotations associated
with the three keypoints. This can be done by specifying the string 'flex', 'axis',
or 'cross-axis' as the first element in the list of angles. The following three
elements in the list are still the three keypoints. The types of rotations
associated with these arguments are as follows:
'flex': flexion-extension angle between the three keypoints'axis': angle of rotation of the vector associated with the second and third keypoints around the axis specified by the first and second keypoints'cross-axis': angle of rotation of the vector associated with the second and third keypoints around the axis perpendicular to both vectors associated with the three keypoints
The following code block shows an example of how to compute the three rotations
associated with the same three keypoints. Note that if no rotation type is specified
like the example shown above, the default rotation type is 'flex' . Thus,
index1 and index1_flex shown below are equivelant.
[angles]
index1 = ["MCP2", "PIP2", "DIP2"]
index1_flex = ["flex", "MCP2", "PIP2", "DIP2"]
index1_axis = ["axis", "MCP2", "PIP2", "DIP2"]
index1_crossaxis = ["cross-axis", "MCP2", "PIP2", "DIP2"]
Here are the first few lines of 2019-08-02-vid01.csv after running
anipose angles with the angle variables shown above:

Automating the Process
All of the steps that we walked through above can be classified either as data acquisition or data visualization. If you are only interested in obtaining the data generated by Anipose, you can run
anipose run-data
which is equivalent to running the following sequence of commands from above:
anipose analyze
anipose filter
anipose calibrate
anipose triangulate
anipose angles
Similarly, the command
anipose run-viz
runs only the Anipose commands regarding data visualization:
anipose label-2d
anipose label-3d
anipose label-combined
In the future, if you don’t want to run the steps of Anipose individually, you can execute them with a single command:
anipose run-all
Which is equivalent to running anipose run-data, followed by anipose run-viz.
Additional Notes
If you would like to run a command that you have already executed, you will have to delete or rename the folder that was originally generated by that command. If you don’t, Anipose will assume that this step has already been completed and will not update the existing files.