Setting up Anipose for 2D tracking
So you want to setup Anipose for 2D tracking at scale? Well, you’ve come to the right place!
Just follow these steps:
Train a network to label your data using DeepLabCut
Setup your folder structure for the experiment in the appropriate format
Create a
config.tomlfile with the parameters for your experiment
Folder structure
Anipose tries to follow the organization that people tend to come to naturally for organizing behavioral videos, with one key modification.
The modification is that the final folder should be videos-raw.
This allows Anipose to know these are the input videos, and to create
further folders with the processed data (e.g. pose-2d,
pose-2d-filtered, videos-labeled).
Here is the general layout of files for videos for 2D tracking
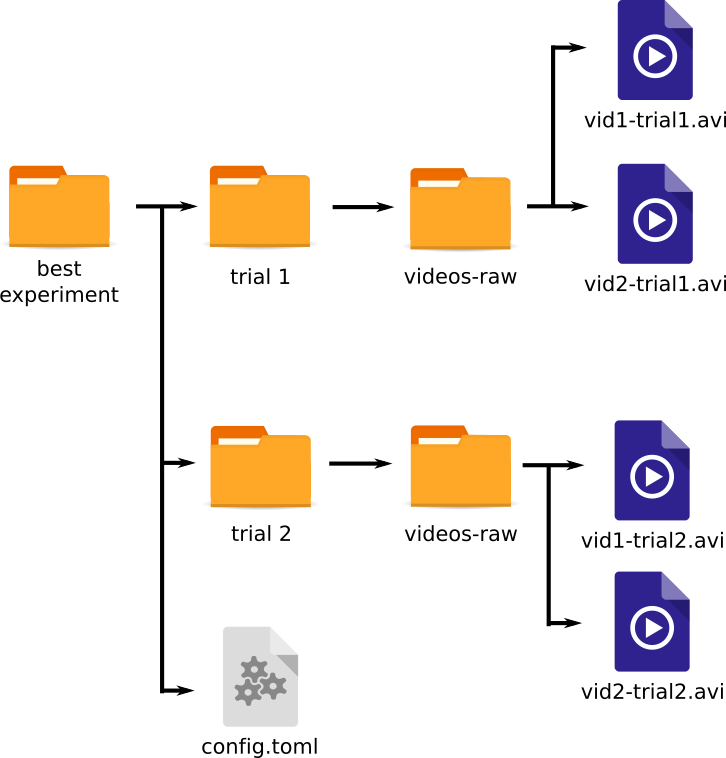
experiment/config.toml
experiment/trial 1/videos-raw/vid1-trial1.avi
experiment/trial 1/videos-raw/vid2-trial1.avi
experiment/trial 2/videos-raw/vid1-trial2.avi
experiment/trial 2/videos-raw/vid2-trial2.avi
There is one main experiment folder, and some subfolders under that. The names for the experiment and session folders can be whatever you like.
Furthermore, the nesting can be arbitrarily large. Thus, an equally valid structure could be (here with nesting of 2 folders instead of 1 as above, note the arbitrary names as well):
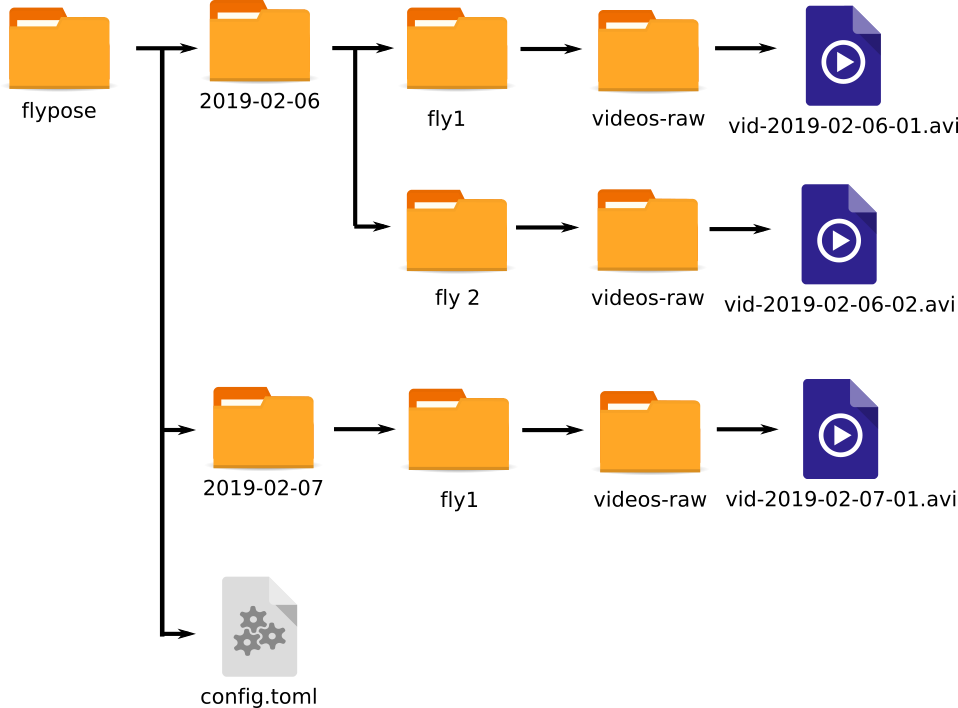
flypose/config.toml
flypose/2019-02-06/fly1/videos-raw/vid-2019-02-06-01.avi
flypose/2019-02-06/fly2/videos-raw/vid-2019-02-06-02.avi
flypose/2019-02-07/fly1/videos-raw/vid-2019-02-07-01.avi
Configuration
Got your folder structure setup? Great! Let’s setup the configuration!
Anipose uses the TOML configuration format, as it is simple and can be read/written easily from Python and Matlab. Consider reading through the specification to get a sense of it.
Below is an annotated example config file for 2D tracking. Create a file
called config.toml within your experiment folder with this
structure, and update the parameters.
# Project name
project = "flypose"

# Change this to match deeplabcut folder (one with trained network)
model_folder = '/Data/Videos/DLC_Analysis/Running-Brandon-2019-01-29'

# How many folders are nested in structure?
nesting = 1

[pipeline]
videos_raw = "videos-raw" # change this if you'd like to change name of "videos-raw" folder

# labeling scheme...specify lines that you want to draw for visualizing labels in videos
[labeling]
scheme = [
  ["head", "thorax", "abdomen"],
  ["thorax", "leg-1"]
]
Filtering the data
You may enable filtering of the data (it is off by default). This compares the data to a median filtered version and looks for outliers. We found this helps find and remove tracking errors, even if the score is high for these.
To do this, you can edit your config with these parameters:
# Settings for a threshold filter
# Removes data outside threshold (probably errors in tracking), and interpolates
[filter]
enabled = true
medfilt = 13 # length of median filter
offset_threshold = 25 # offset from median filter to count as jump
score_threshold = 0.8 # score below which to count as bad
spline = true # interpolate using cubic spline instead of linear
Running Anipose
With the configuration file and folder structure setup, you can now run Anipose on your full dataset!
For 2D tracking, the relevant commands are as follows:
anipose analyze # analyze the poses for each video
anipose filter # filter out the tracked poses
anipose label_videos # create videos for each pose
anipose summarize_2d # summarize the 2d tracked data (both raw and filtered)
anipose summarize_errors # summarize the errors in the tracking
To run these, open a command line window, go to the folder where your experiment is stored, and run one of the commands above.
Summarizing the data
After computing the whole pipeline for all videos, the final outputs of interest (the 2D coordinates) are scattered across a lot of folders.
For further processing and analysis, it is often useful to have one central file with all the data. Hence, Anipose provides the command “summarize_2d”, which summarizes everything into a “summaries” folder. The output csv for the 2d tracking coordinates has all the data from all sessions, and a few extra columns to show where the data comes from.